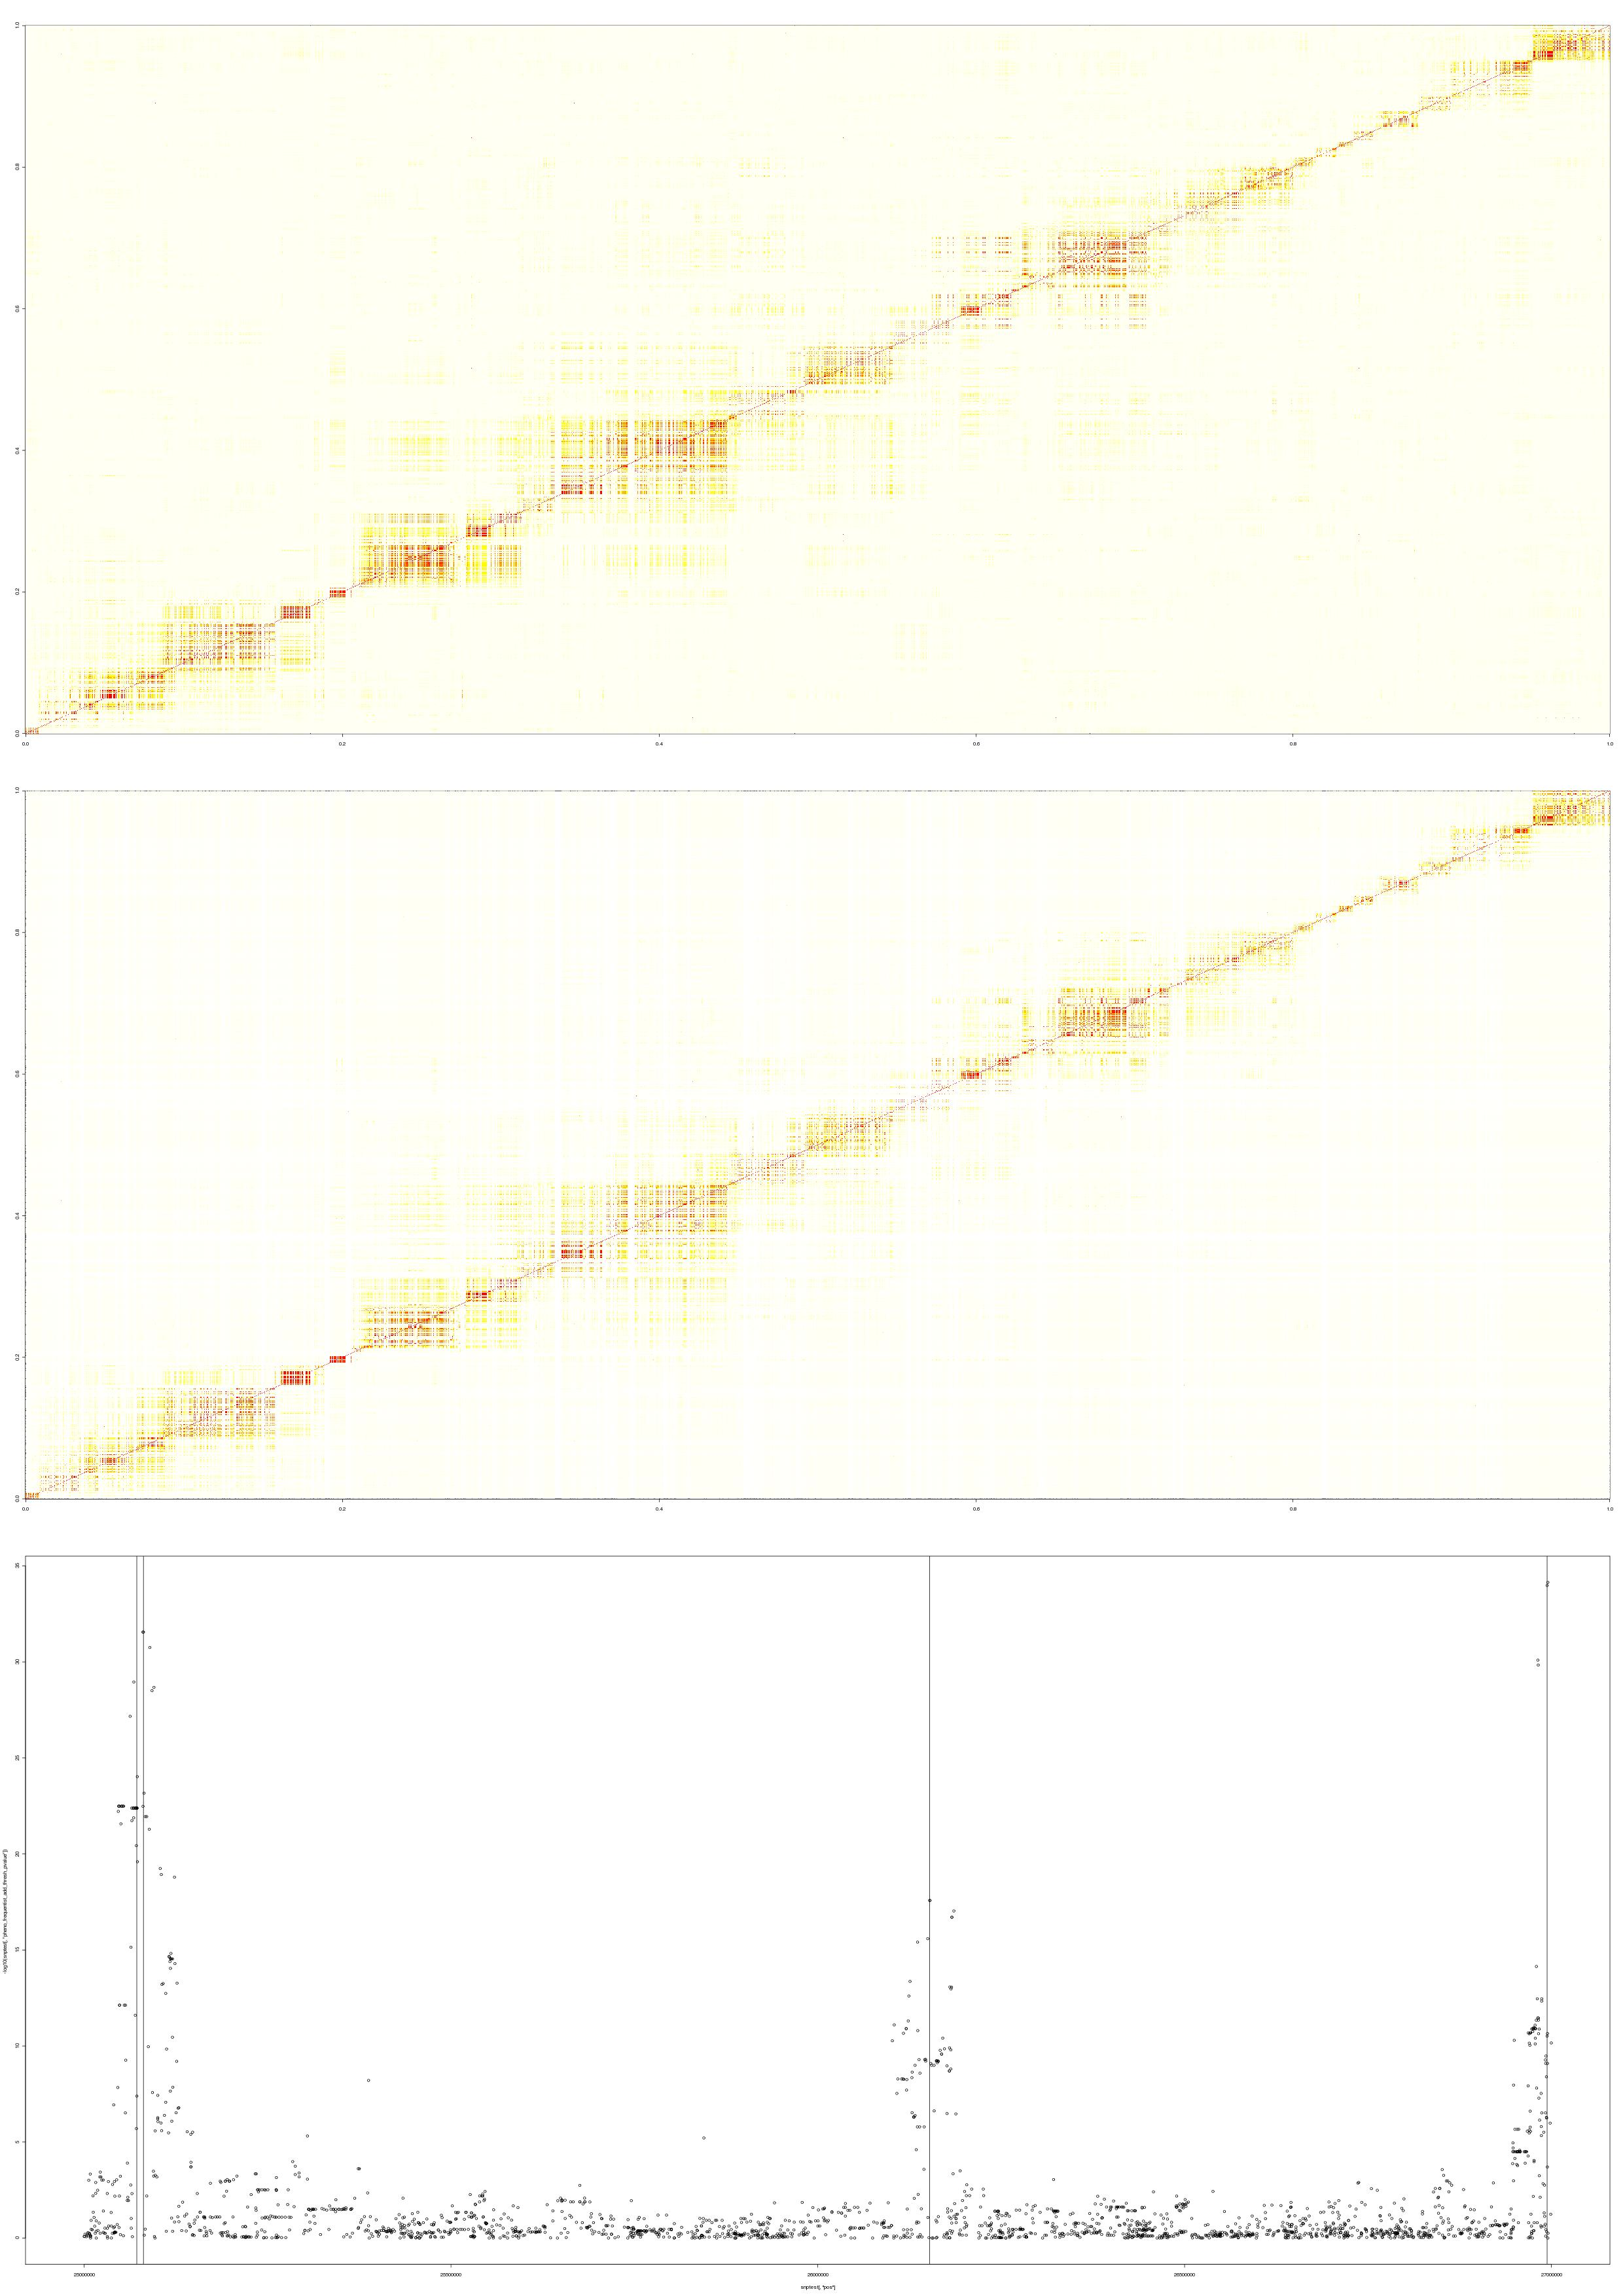
Example 1: Comparison of LD patterns between reference panel and simulated data
Below is a plot for an example simulated data set from HAPGEN2.A 2Mb region on chr21 of CEU HapMap was used as the reference panel and 1000 cases and controls were simulated (using HAPGEN version 2.0.1) with 4 disease SNPs, with position, heterozygote relative risk and homozygote relative risk:
- 25071735, 2, 4
- 25080818, 2, 4
- 26152542, 2, 4
- 26994130, 4, 4
The first two plots are the LD patterns in the region for the reference panel (top) and the simulated case-control data (middle). The bottom plot shows the -log10(p-value) under the frequentist additive test performed on the data. Therefore, in this example, the LD patterns between the simulated data sets and the reference panel are similar and the p-values distributed as expected from the specified effect sizes.
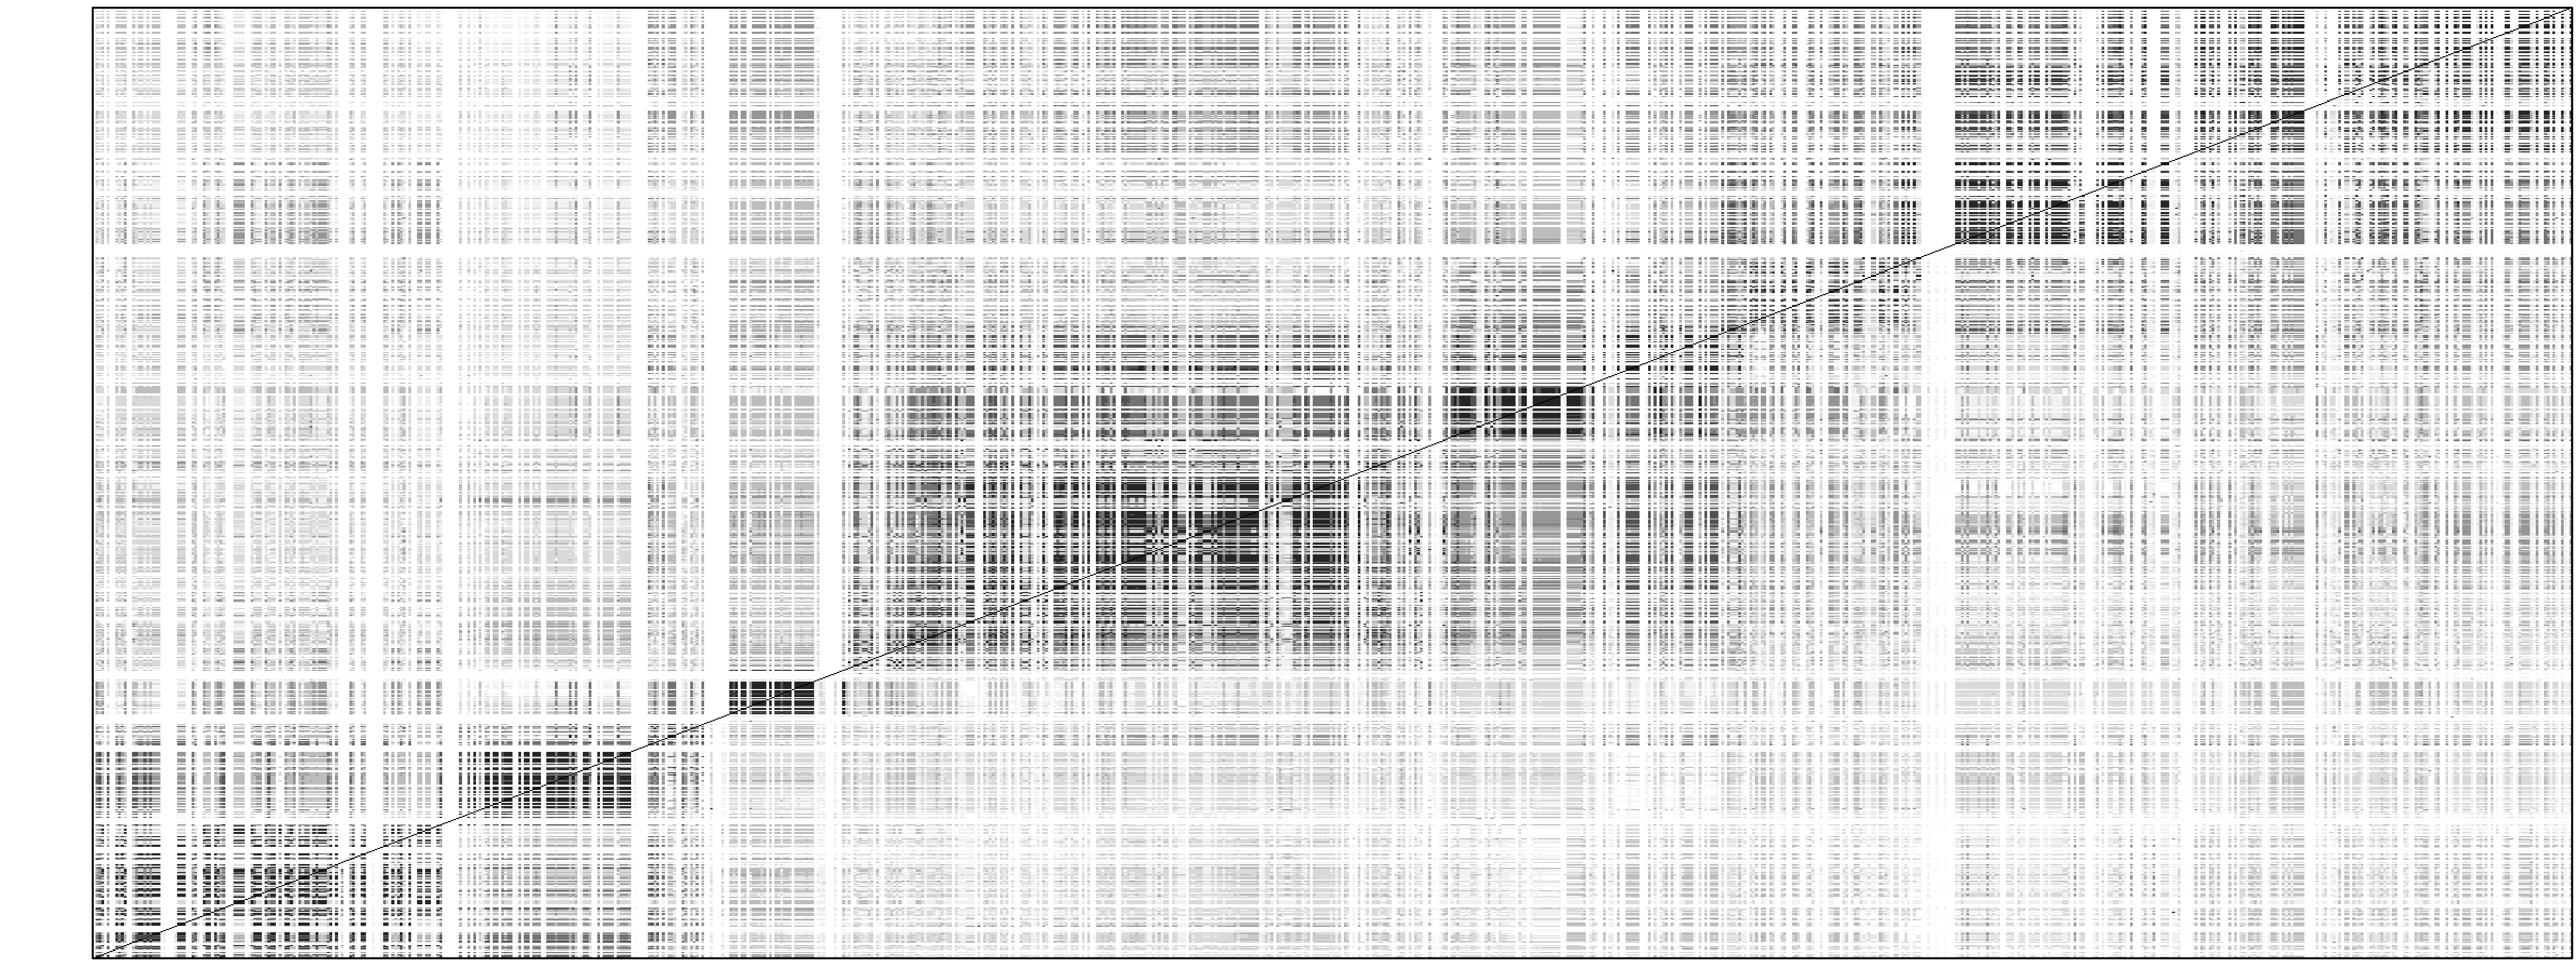
Example 2: Simulation of independent disease SNPs
Using HAPGEN version 2.1.0, we have simulated, using HapMap2 CEU as the reference panel, 2000 cases and 2000 controls at 880 SNPs across a 700kb region on chromosome 21, with 3 disease SNPs, at positions d1 = 25356790, d2 = 25390071 and d_3 = 25691378, each under a log-additive disease model with a heterozygote relative risk of 1.3. The simulation process took less than 10 seconds on a 2.93 GHz processor laptop, and will increase linearly with the number of SNPs and individuals.
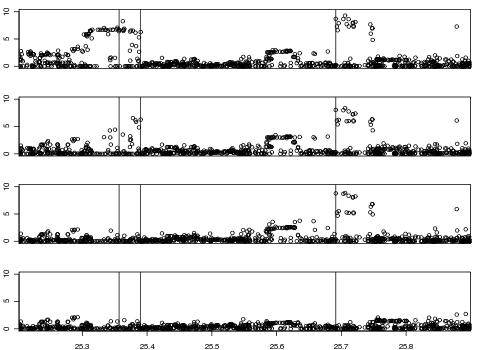
The figure below shows the similarity between the the LD patterns of the reference panel and the simulated haplotypes, which are illustrated above and below the diagonal respectively. The second figure plots, at the top, the -log10(p-values), for the log-additive test, across the region, illustrating the signal of association at the disease SNPs; subsequent plots show the p-values conditioned on the genotypes at d1, at d1 and d2, and at d1, d2 and d3 respectively, confirming that there are indeed 3 independent disease SNPs.