GENECLUSTER analysis of WTCCC data
Here are some examples of the GENECLUSTER method applied to the data from the WTCCC data. Below are signal plots (produced by the R script provided on the GENECLUSTER webpage) for:- the Crohn's disease data in the NOD2 region of chromosome 16, which is an established region of association identified with multiple causal mutations[1-2];
- the Crohn's disease data in the IL23R region of chromosome 1, which is another established region of association identified with multiple causal mutations[3].
- boost signal of association when there are mulitple causal mutations;
- identify the presence of mulitple causal mutations;
- accurately identify the causal mutations, even if they are not genotyped in the study samples.
NOD2 (chromosome 16)
Figure 1 compares the signals of association for Crohn's disease at NOD2 at SNPs on the Affymetrix chip, imputed SNPs and the 1-mutation and 2-mutation models of GENECLUSTER, which allow one and two mutations on the tree at each position respectively. All the methods show a substantial signal at the locus but the signal for GENECLUSTER are higher and broader. The signals are also much smoother across the region than the signals from the typed and imputed SNPs. The 1-mutation and 2-mutation log10 Bayes factors peak at 11.44 and 13.33 respectively (larger values of the Bayes factor indicate stronger evidence for association). These compare favorably with the log10 Bayes factors at the best Affymetrix SNP (12.00) and the best imputed SNP (11.42); so GENECLUSTER provides a stronger signal than comparable current approaches.The difference of the log10 Bayes factors under the 2-mutation and 1-mutation models is 1.89, indicating that the data is about 10^1.89 = 78 times more likely under the 2-mutation model than the 1-mutation model. If the 1- and 2- mutation models were thought equally likely a priori this would imply a posterior probability of 0.987 for two mutations versus one mutation indicating substantial evidence of allelic heterogeneity.
There are three known coding SNPs in the NOD2 region[1-2]. Two of these SNPs (rs2066845 and rs2066844) are in the HapMap reference panel. The plot below shows that the three distinct haplotypes induced by these two SNPs correspond well to those identified by the best fitting 2-mutation model. For example, one of the two best mutations (red) precisely identifies the CEU haplotypes that carry the rare rs2066845 mutation while the other mutation (green) is only one branch away from precisely identifying the haplotypes that carry the more common rs2066844 mutation. In other words, our analyses of the WTCCC data using the new method go very close to recovering the known pattern of disease susceptibility, based on much more extensive genotyping. Relative risk estimates of red and green mutations on the tree, relative to a lack of either of these mutations, are 2.15 and 1.56 respectively.
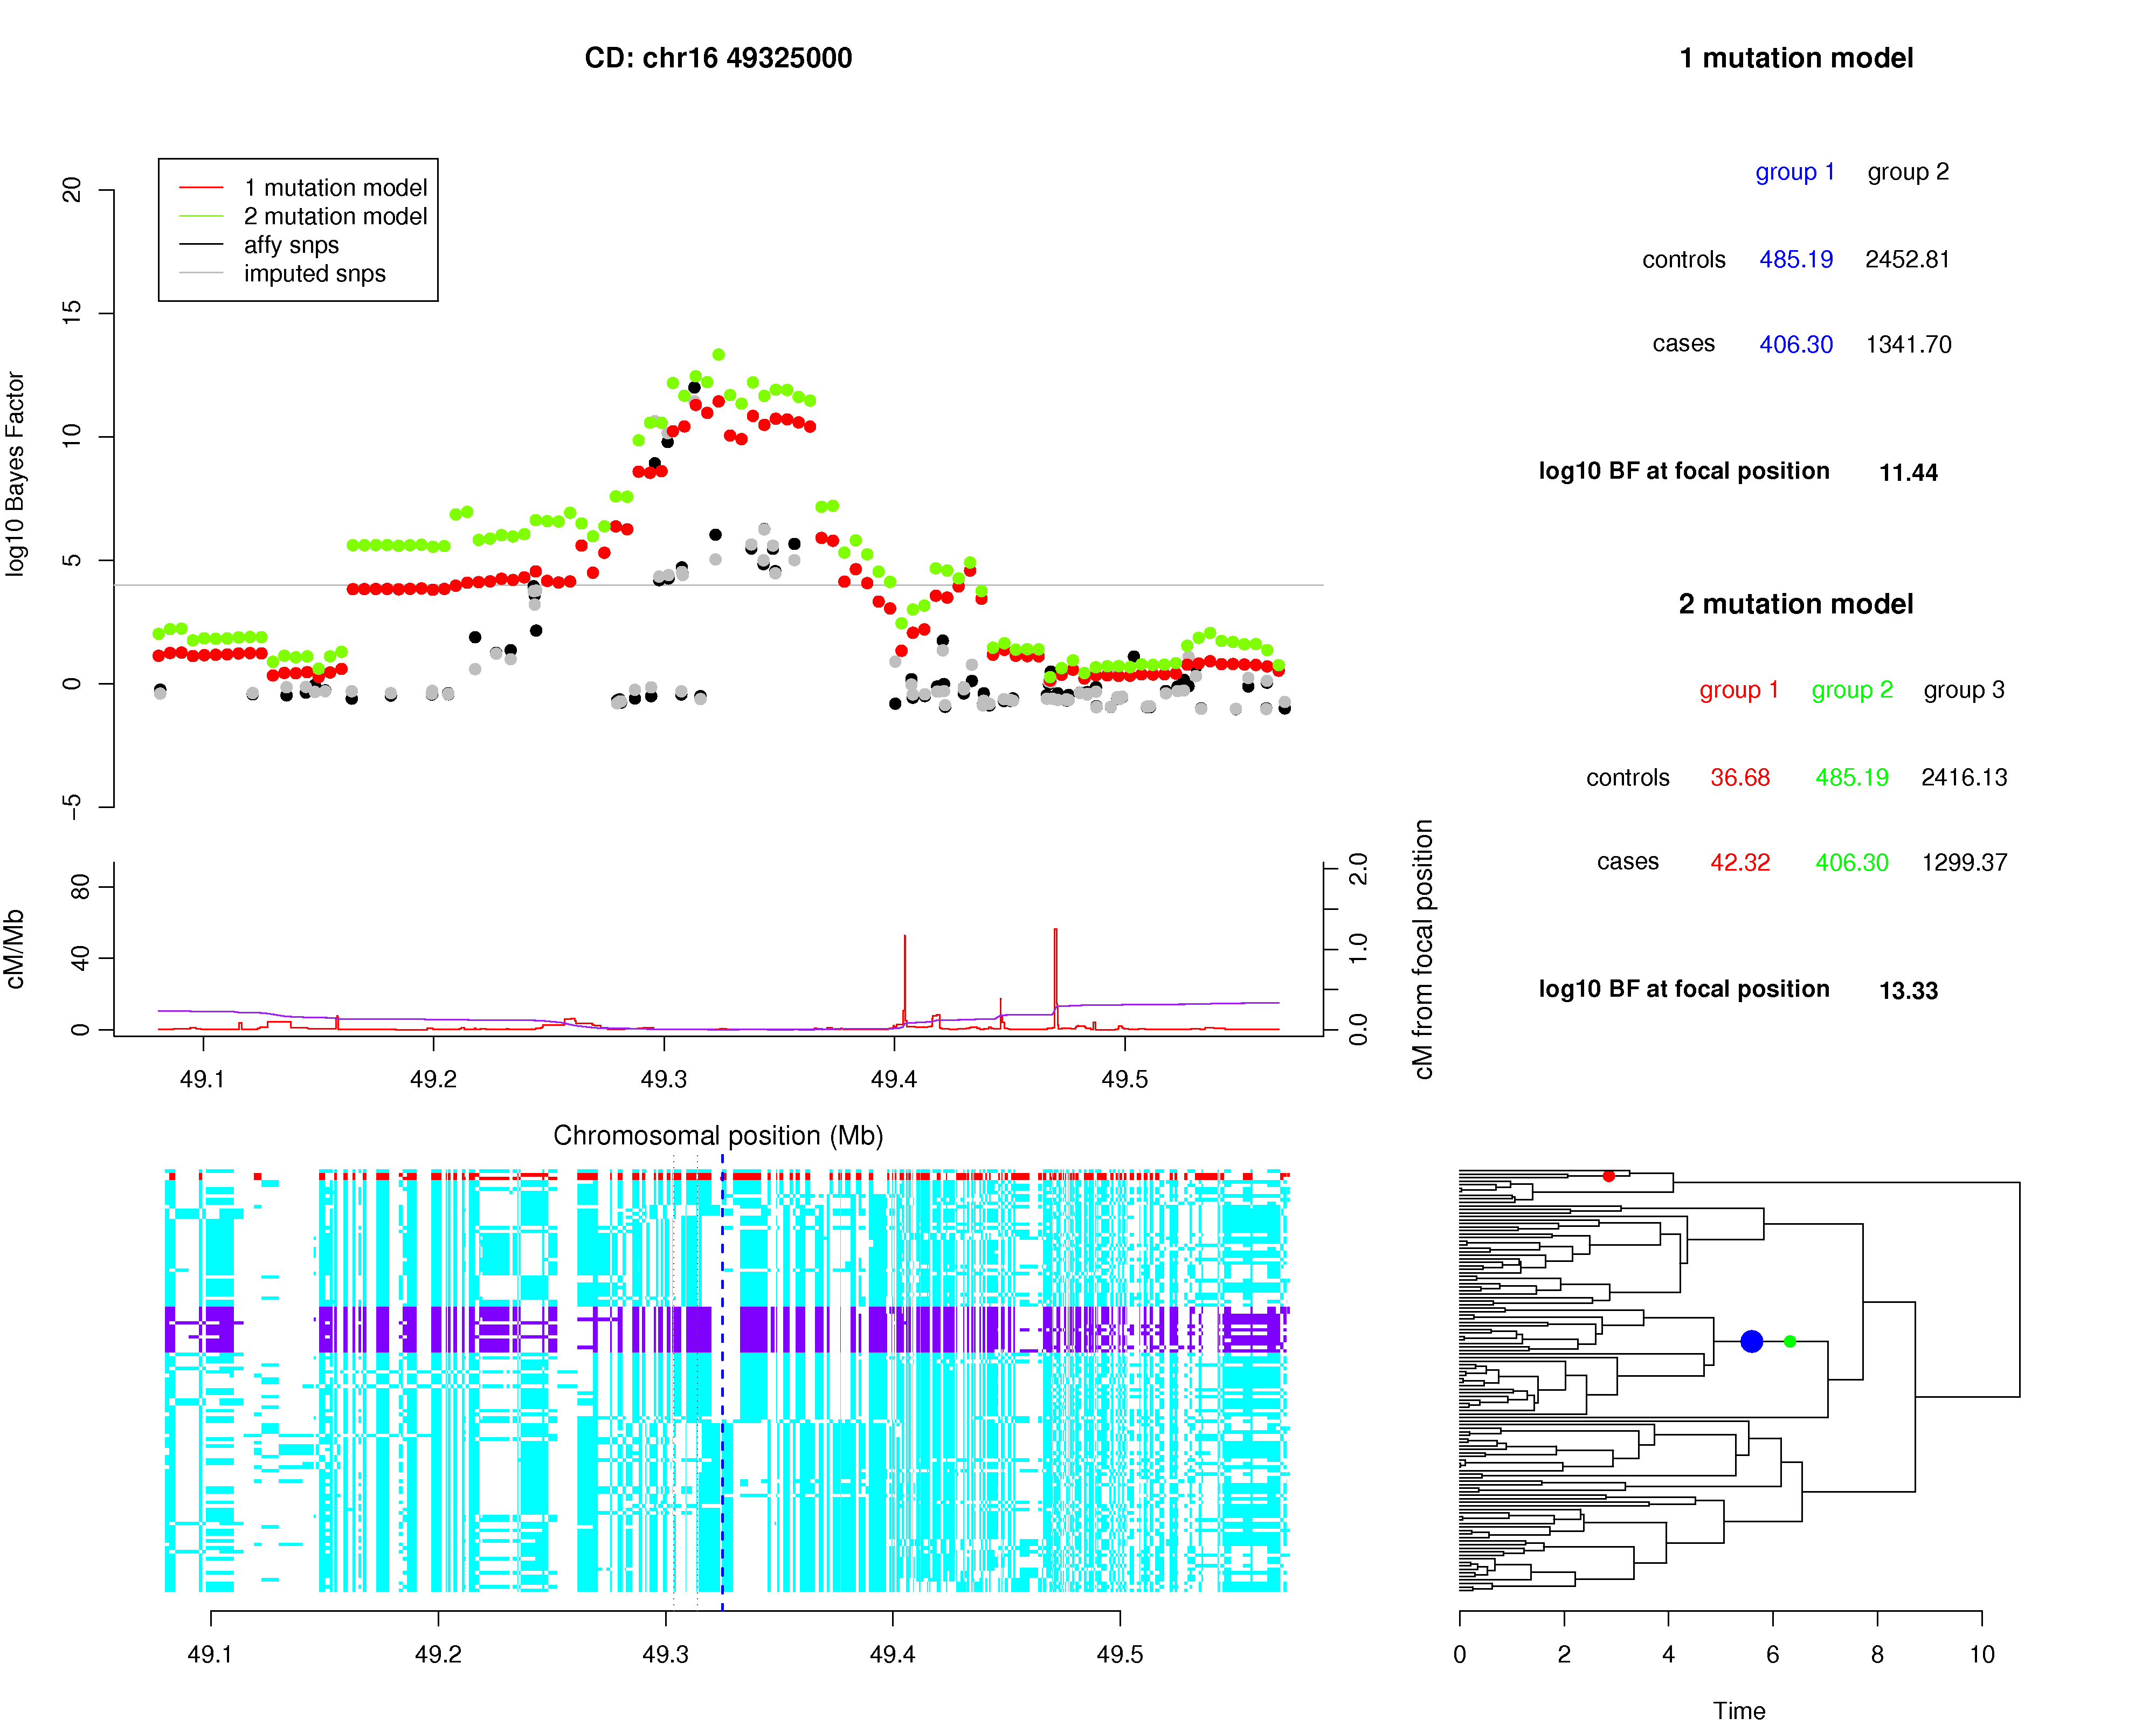
Figure1: The top left panel of the plot shows the log10 Bayes factor for the 1-mutation model (red) and 2-mutation model (green) within the NOD2 region of the Crohn's Disease analysis. The recombination map (red line) and the cumulative recombination map (purple line) are shown below this. The bottom left panel shows the 120 CEU HapMap haplotypes across the region. Each row of this panel is a haplotype and each column is a SNP. The haplotypes are colored to indicate the three haplotypes that occur at the 2 coding SNPs rs2066844 and rs2066845 (red = CC, purple=TG, cyan=CG). The dashed vertical blue and brown lines indicate the position of the largest log10 Bayes factor for the 2-mutation model (the focal position) and the 2 coding SNPs respectively. The bottom right panel shows the estimated genealogical tree at the focal position. The x-axis of the plot was chosen to provide a clear view of all the branches in the tree. The branches associated with the best 1-mutation and 2-mutation models that make the largest contributions to the Bayes factors are shown with blue and red/green dots respectively. The top right panel shows the tables of expected allele counts for the 1-mutation and 2-mutation models together with a summary of the Bayes factors that occur at the focal position. The columns of the tables are color matched to the mutations on the tree in the bottom right panel.
IL23R (chromosome 1)
The IL23R locus on chromosome 1 is another established disease locus for Crohn's disease with extensive known allelic heterogeneity[3]. A plot showing the results of GENECLUSTER in this region is given in Figure 2. The log10 Bayes factors, at the IL23R locus, are 12.96 and 17.99 for the 1-mutation and 2-mutation models respectively, which compare favorably with the best Affymetrix SNP (10.07) and the best imputed SNP (15.82). The difference between the 2-mutation and 1-mutation Bayes factors implies a posterior probability of 1.00 for two mutations versus one mutation, indicating overwhelming evidence of allelic heterogeneity.The original paper[3] identified two SNPs in functional regions of the IL23R gene. The first SNP (rs11209026) is the non-synonymous SNP (c.1142G>A, p.Arg381Gln) identified as the strongest signal in the original study. The second SNP (rs10889677) is in the 3' UTR of the IL23R gene and the only other associated non-intronic SNP found in the original study. When we look at these two SNPs in the CEU HapMap panel we identify three distinct haplotypes colored green, purple and blue in Figure 2. These haplotypes are almost precisely those that are delineated by the two mutations that make the largest contribution to the 2-mutation Bayes factor. One of the mutations on the tree (colored red) identifies all the CEU HapMap haplotypes that carry the A allele at rs11209026 and the second mutation (colored green) identifies all but one of the haplotypes that carry the A allele at rs10889677. Relative risk estimates of red and green mutations on the tree, relative to a lack of either of these mutations, are 0.384 and 1.29 respectively.
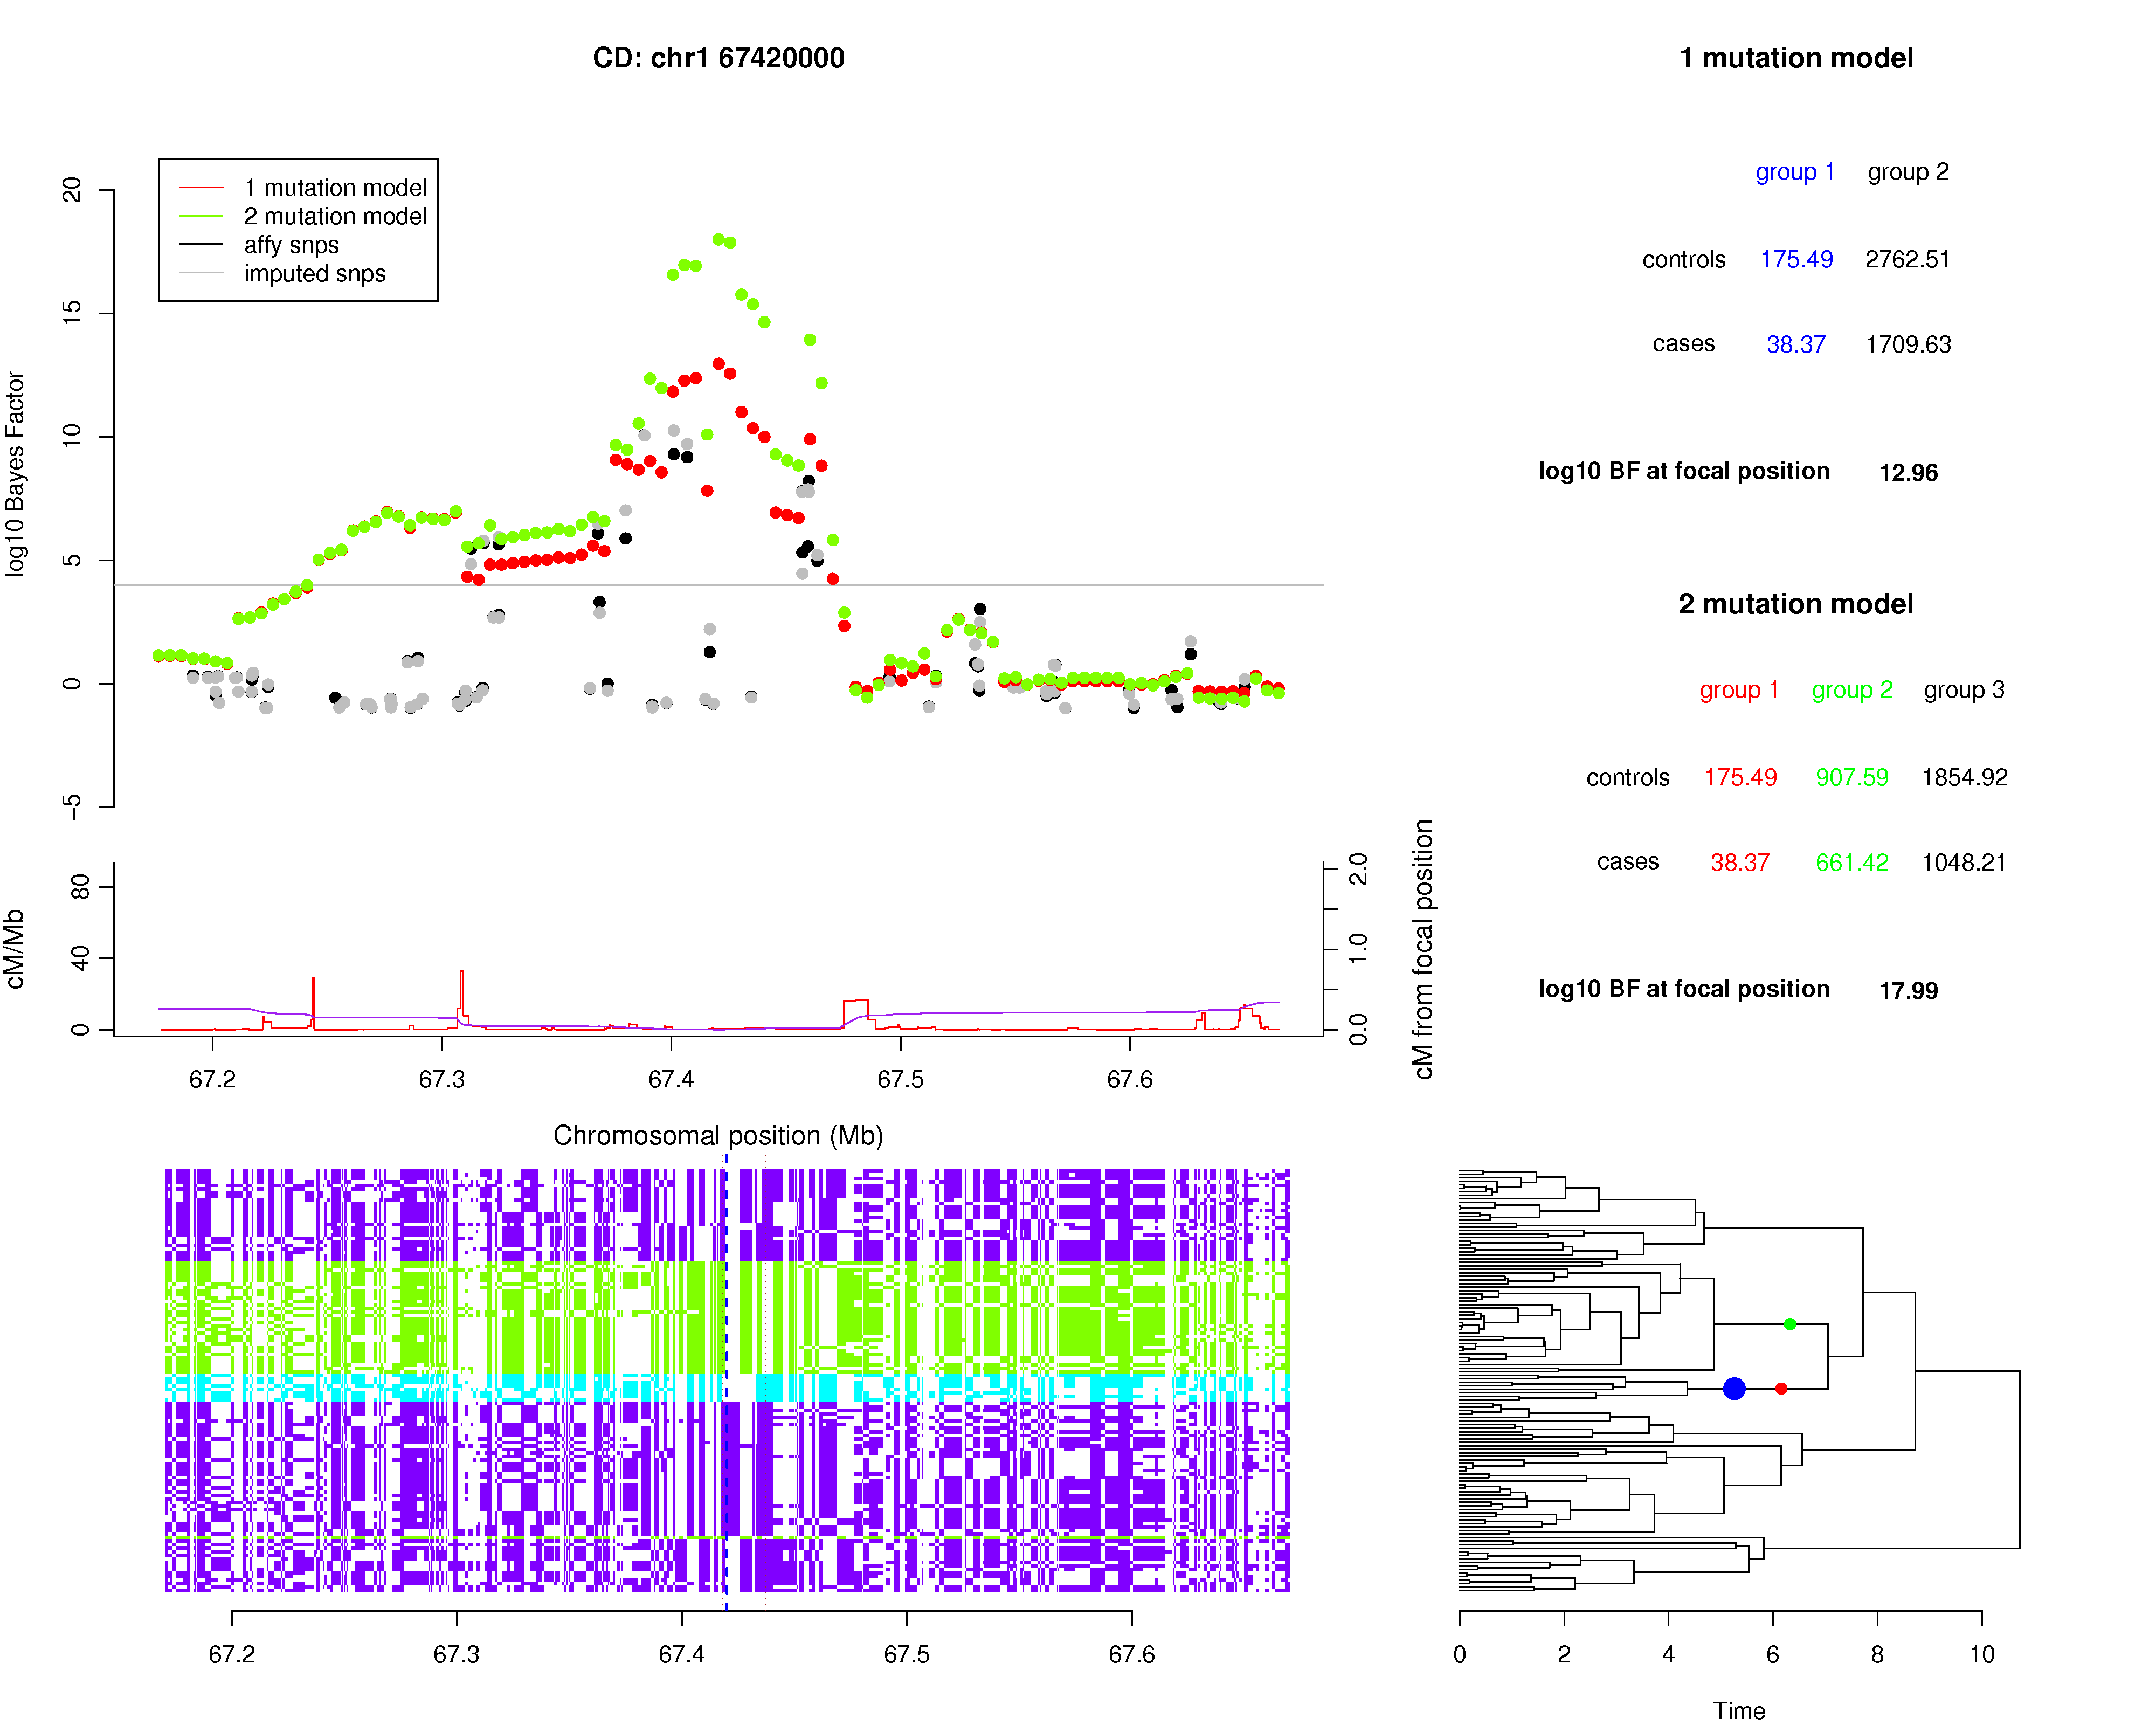
Figure 2. The top left panel of the plot shows the log10 Bayes factor for the 1-mutation model (red) and 2-mutation model (green) within the IL23R region of the Crohn's disease analysis. The recombination map (red line) and the cumulative recombination map (purple line) are shown below this. The bottom left panel shows the 120 CEU HapMap haplotypes across the region. Each row of this panel is a haplotype and each column is a SNP. The panel haplotypes are colored to indicate the three haplotypes that occur at the 2 coding SNPs rs11209026 and rs10889677 (blue = AC, purple=GC, green = GA). The dashed vertical blue and brown lines indicate the position of the largest log10 Bayes factor for the 2-mutation model (the focal position) and the 2 coding SNPs respectively. The bottom right panel shows the estimated genealogical tree at the focal position. The x-axis of the plot was chosen to provide a clear view of all the branches in the tree. The branches associated with the best 1-mutation and 2-mutation models that make the largest contributions to the Bayes factors are shown with blue and red/green dots respectively. The top right panel shows the tables of expected allele counts for the 1-mutation and 2-mutation models together with a summary of the Bayes factors that occur at the focal position. The columns of the tables are color matched to the mutations on the tree in the bottom right panel.
References
- Hugot, J.P., et al., Association of NOD2 leucine-rich repeat variants with susceptibility to Crohn's disease. Nature, 2001. 411(6837): p. 599-603.
- Ogura, Y., et al., A frameshift mutation in NOD2 associated with susceptibility to Crohn's disease. Nature, 2001. 411(6837): p. 603-6.
- Duerr, R.H., et al., A genome-wide association study identifies IL23R as an inflammatory bowel disease gene. Science, 2006. 314(5804): p. 1461-3